
 Reading Time: 6 minutes
One of the most important points of knowledge in an organic search campaign is understanding where the search engine optimization (SEO) value lies within your site. Without a deep dive into the individual areas of a site on a regular basis, a search marketer is left blind in understanding where exactly success is working and where opportunity lies.
The Whole is Greater than the Sum of Its Parts . . . Sort of
Aristotle didn’t offer SEO services, but he was partially correct in his famous saying. Yes, the whole is what creates your domain authority and, together, all parts will create a much more authoritative site. However, if you want to find which content is really performing on your site, you are going to have to use tools and manually review to get to the bottom of true SEO content analysis.
SEO has come a long way in the past decade. You can no longer simply report on keywords and total referrals. Now it is important to know what content works for SEO, social media, and link building and what areas of the site bring conversion success for the website.
Let’s get to it!
Note: This is not an opportune process for those who have a flat site architecture. Completing this process without any sense of URL folder structure is much more difficult. While this process is important for SEO success, if you fall into the non-organized content group, your first priority should be a URL rewrite to organize content into appropriate folders
First Step: Analytics
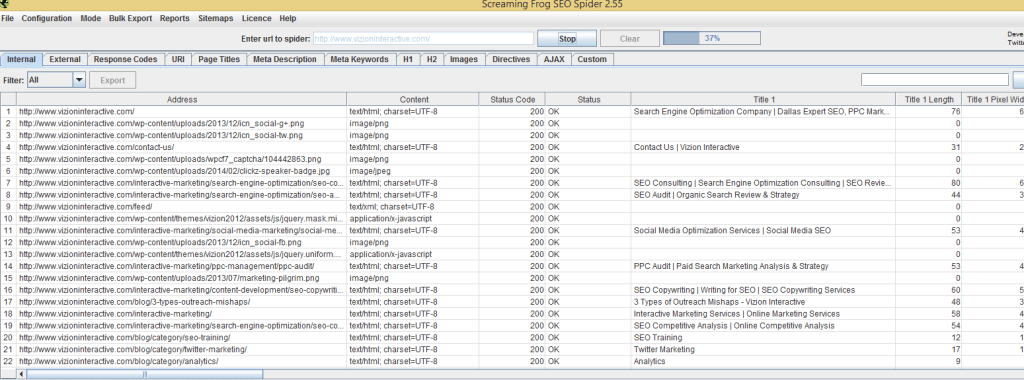
You are going to want to start this process by setting up Content Grouping in Google Analytics. In order to do this you will want to run the site through a site scraping tool such as Screaming Frog.
Once you have run this report, export it into an XLS format where you will then sort by URL. The reason you are doing this is to gain visual insight on the taxonomy of the site to see how content is bucketed into folders. From this file, pull all of the main categories and folders from the list.
From here you will now create Content Groups in Google Analytics.
From the knowledge you gained previously about all of the folders on your site, you will now set up individual Content Groups so each includes a rule stating that any URL contained in the said folder will be bundled in this group. You will now be able to see this view of data through the Behavior section of Google Analytics, in the All Pages and Landing Pages sections.
What am I learning from this?
- The image above shows you how to look at the section of the site that drives the most organic traffic
- Sorting by conversions, you can see which pages are driving organic traffic
- Sorting by bounce rate, you can see which sections of the site have difficulty holding organic traffic within the site
I know you are excited, but this is where I calm you down. You have created the content groups, but the data collection starts today, so you will have to wait at least a few weeks to review data through this lens. However, this will not stop our review. We must move on!
So far you have reviewed the site’s folder structure, and you have a pretty good understanding of which folders you have on the site. You will take this into the filtering field of the Organic Landing Pages.
This allows you to manually perform the Content Grouping style of segmentation. Again, from a high level you are assessing if a folder drives traffic, if it drives leads, and whether it has an issue with user behavior metrics. From assessing those areas that are working, ask yourself why these sections are working.
Are there SEO on-page factors in play in those site sections that are doing well that could be utilized in folders that are not performing well? These factors include title elements, keyword synergy on-page, value of internal linking to these site sections, and inbound links to these site sections.
Second Step: Visibility
From your review of content by section, we hope you were able to identify why some of the content sections may be working well and how there may be a lack of SEO factor implementation in those areas. Now let’s take a look at the content areas of the site through Google’s eyes. You will learn which sections and pages receive the most impressions and, of that visibility, which terms drive the referrals.
You will now go to the SEO section of Google Analytics. There you can view impressions of Landing Pages by site section using filtering or from a broad level. If you wish, you can export all Landing Page impressions and sort the site sections in Excel for a holistic view and create a pie chart. This will help you better understand the dominance of site visibility by site section and page. Alternatively, you can use filters to analyze your data from a finer perspective, as I have done above. This practice helps you understand which pages are driving the impressions on-site.
Next, you will step into SEMrush and look at total visibility in Google as it relates to keywords and their ranking pages. You will want to export all of the organic keywords and, from within the XLS export, sort by URL so you can see ranking terms by their site section.
What am I learning from this?
- Gain insight on which site sections hold the most impression value on the site and which do not. Is there any correlation in the use/non-use of on-page/off-page SEO in these two visibility types?
- Of your total ranking visibility, which site sections have the most keywords? The data shown on Google’s impression should be similar to that on SEMrush.
- Of the site sections that are showing the most and least visibility, what are the keywords’ ranking to Landing page associations? Can you find where content and SEO best practices have served you well and understand why the underperforming are lacking?
Third Step: Off-Page/Links and Social Virility
SEO success has never been solely about the on-page best practice usage as off page factors such as inbound links have always played a part. Today, the links matter more, the quality of those links are increasingly important, and social citations and buzz about your site’s content have become valuable.
So far you have begun to get a good feel for which content on your site is working, which is not working, what content Google prefers to show, and the keywords that help that content display in search results. How does that content get the additional gusto? It is highly likely that this successful content is working so well because of the inbound links it has generated. You will want to go to OpenSiteExplorer and run a report on the URL, then navigate to the Top Pages tab. From there you will request a CSV export to sort and review.
Once you have exported the file, open it and sort as necessary. The first thing you should do is clean out the URLs so only 200 status code “live” pages are present. If you do see 404/302/403, etc., keep the list and fix these via 301 redirection. Next, sort by URL folder as you have done with previous exports.
What am I learning from this?
- You are now able to see by site section and folder which URLs have link equity.
- You can see data on social sharing activity by page or content section of the site.
- Are there content areas on the site that you felt should have more inbound links and social attention? Have you done a good job of influencer outreach, link building, and social promotion for this content?
While we are able to see social metrics from the last export, I urge you to take it a step further and review BuzzSumo. This will give you up-to-date numbers on social buzz for your content while the previous tool can be as far as a few months behind. It is highly likely the content you see will be of the blog, resource, and news variety as that usually has the most virility. That’s all right, though. Hopefully you can see the content that you have that “has legs.” Is there site content that you expected to be here? You might look into refreshing it for greater appeal or rethink your distribution and promotion angles.
Tip: Want to make it fun? An export from this tool will show share counts across social properties by author. Nothing like a little friendly company blogging competition!
Conclusion
We hope the three content segments we have reviewed have shed light on which content on your site is working well to drive traffic and convert visitors and the content that Google rewards with search result visibility. We also hope you see some successful areas. This will help you uncover what factors you have employed with successful content so you can deploy this in suffering site sections.
Another tip to this process is that this content analysis (minus analytics) can be used on your competitors’ sites. This will allow you to conduct a competitive content gap analysis to understand how they have become successful in their content strategies.
At Vizion Interactive, we have the expertise, experience, and enthusiasm to get results and keep clients happy! Learn more about how our SEO Audits, Local Listing Management, Website Redesign Consulting, and B2B digital marketing services can increase sales and boost your ROI. But don’t just take our word for it, check out what our clients have to say, along with our case studies.


