
 Reading Time: 5 minutes
As a marketer, the amount of data, metrics, and information out there can feel overwhelming. Organizing data in a way that allows you to actually use it to benefit your business takes using the right tools at your disposal. One of the best (free!) tools out there is the Google Analytics Dashboard. The Analytics Dashboard lets you easily organize, categorize, and view different metrics in ways that can actually be useful. Follow the steps in this Google Analytics Tutorial to create a new Dashboard, customize it, and start analyzing metrics like a pro.
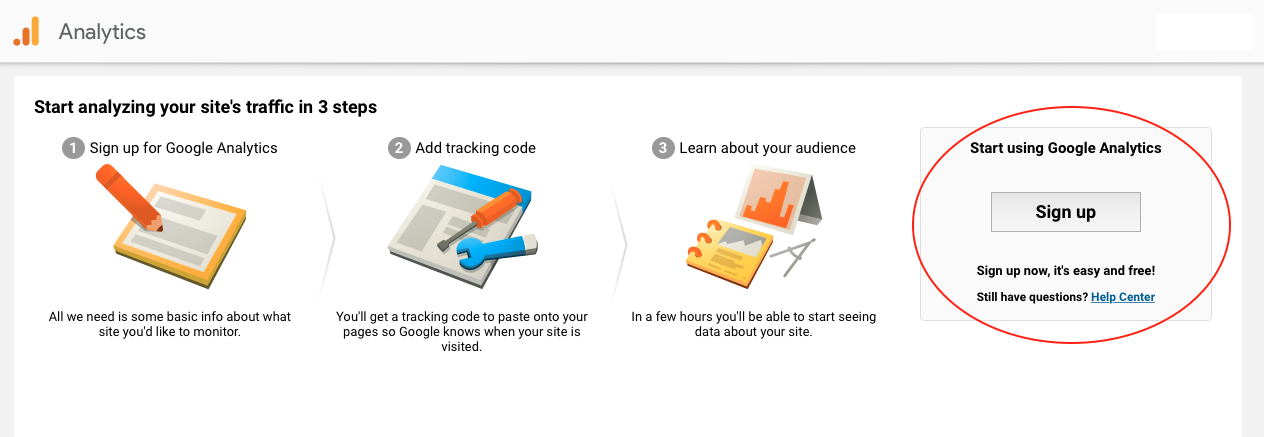
Sign Up for Google Analytics
Before you can set up a Google Analytics Dashboard, you need Google Analytics. Visit the Analytics sign up page to either sign in to your existing account or create a new one. If you already have an account, log in and go to the website profile that you wish to create the Analytics Dashboard for.
Create a Customized Google Analytics Dashboard
Select the “Home” screen in Google Analytics. Then, select “Customization” (the first option on the menu on the left).

A drop-down menu will appear under Customization. Select the first (top) option, “Dashboards.”

This will take you to the main Dashboard Creation screen.

Once here, click the red “Create” button. Google will give you a choice between Blank Canvas and Starter Dashboard. The Google Starter Dashboard is the right choice if this is the first dashboard you’ve created. With this option, you simply create a title and instantly gain access to a working dashboard. With either option, you can start from scratch or select “Import from Gallery” to select a dashboard from a selection of templates other users have already created. Here’s the Import from Gallery view if you go that route:

With this option, you can filter the templates you see according to many different search parameters. You can choose an option based on its rate or from articles such as “Best Analytics Dashboards.” Find the template you like and press “Import” below the one you want to use. This will apply it to your custom dashboard. If you choose to start a completely blank canvas for your Google Dashboard, Google will take you to a page where you can add widgets, choose which metrics to show, filter data, and more:

For the purposes of this Google Analytics Tutorial, we’re going to use the Starter Dashboard. Come up with a title and create your dashboard. Then, customize your dashboard to optimize your results and usability.
Customize Your Google Analytics Dashboard
You have the power to edit each widget in your dashboard. Widgets are applications you can add to your Google Analytics Dashboard to obtain certain information. If you chose the Blank Canvas option, it will remain blank until you add widgets. The Starter Dashboard will automatically come with some widgets. You can edit your existing widget by clicking the Edit button in the top right-hand corner of the widget box, where you see a pencil icon. Editing a widget takes you to this screen:

You can customize the entirety of your widget display. Choose the type that works best for the metrics you wish to display. Play around with your settings to find the best display for your needs. Here’s a breakdown of all of your widget options in the Google Analytics Dashboard:
- Standard vs. Real Time. Some widgets can display real-time data about your website. They update automatically. Standard widgets, on the other hand, only update when you refresh your dashboard. Counter, Timeline, Geomap, and Table are all real-time widget options.
- The Counter widget displays the number of active users currently on your site. You also have the option to organize active users by a dimension of your choice.
- This option displays a numeric representation of your selected metric.
- See a graph of the metric you choose over time. Then, compare your metric with another metric on the same graph. In Real Time, the timeline shows your page views for the last 30-60 minutes.
- See a map of your selected region, with your metric on the map. Hover over your map to see metric values. In Real Time, see a map that shows where your active users are at that moment.
- You have the option to display up to two selected metrics describing a dimension, laid out in an easy-to-read table. In Real Time, plot active users against up to three dimensions of your choice.
- Select metrics and dimensions you wish to see and press “Pie” to create a pie chart. Hovering over each slice shows you specific metric values.
- See a bar chart of your selected metric, grouped with up to two different dimensions. Hover over each bar for specific values.
Want to add a new widget? Select “+Add Widget” on your main Dashboard menu:

This will bring you to the same pop-up menu as the Edit Widget option, with the added choice of which metric and filters you’d like to see. Customize your Widget to get to the heart of the data you want. If you’re interested in creating a Mobile Traffic Dashboard, for example, filter all of your widgets to only show your mobile user data. The “Link to Report or URL” widget option lets you find relevant reports so you can get more information from a widget. Once you’ve created a widget, you can clone it to duplicate all of your custom settings in a similar widget. You can add up to 12 widgets to any given Dashboard.
Get More Out of Google Analytics and the Dashboard
Now that you know the basics of creating, customizing, and using your Google Analytics Dashboard, you have the power to download and use the metrics of your choice. How you’ll use these metrics to boost business is up to you. It can be beneficial to seek the help of a team of search engine optimization (SEO) experts, like those at Vizion Interactive.
Our Search Engine Optimization Services allow you to work toward measurable business goals through smart use of metrics. We can put you on the true path to better SEO and stronger marketing with services that depend on skill, experience, and hard work. Call (888) 484-9466 to find out how we can help your business master the Google Analytics Dashboard and beyond.


