
 Reading Time: 5 minutes
There’s no doubt page-load time is a very hot topic in SEO right now and has been for the past several years when it officially became a ranking signal for desktop devices in April 2010. And now, with Google officially making page speed a ranking signal for mobile devices in July 2018, there’s no time like the present to circle back and take a look at probably one of the most frustrating ranking signals for which to optimize.
One of the reasons that page-load time is so difficult to bring down to within Google’s preferred load time of 1 to 1.5 seconds (1 second or less for mobile and 1.5 seconds or less for desktop) is that there are many moving parts within the request/render process. This boils down to many, many areas where page-load time can get hung up, dragged down, or sabotaged. It can also mean difficult conversations with developers who don’t understand why these changes need to be made, especially for fixes that are really involved and require a lot of time and resources.
Rather than throwing everything at the wall to see what sticks (and actually results in improved load time for important pages), there are common areas where page-load time frequently gets dragged down, which will usually result in a lot of bang for the development buck if addressed, not to mention a little gray hair saved in the process for the SEO as well.
Images are notorious for slowing things down. Today’s user expectations demand heavy visuals for the website experience, but it can be very difficult to manage so many graphics and still have a speedy load time. To diagnose which images are an issue and how they are negatively affecting a page, investigate the following three areas.
Image File Sizes
Ideally, no image file size should be larger than 50KB. But don’t stop there if you can get the file size even smaller because you’ll probably need it if your page/template has a lot of images, such as for ecommerce sites. Use WebPageTest.org, and view the waterfall graph to evaluate the weight of individual image files. Below is part of a waterfall graph for the home page of a local animal shelter in Austin. Notice the long purple bar with dark and light portions. The dark portion indicates a long download time, which is usually caused by a large file size. This long, dark purple bar is what you should keep your eye out for when evaluating the waterfall graph for image issues.

Next, click on the bar to open up a detailed view of that request, and look at the number for the “Bytes In (downloaded),” which is the size of the file being downloaded. At nearly 1.2MB, this image file is enormous and way beyond the 50KB recommended size. These are exactly the types of images you want to zero in on to help bring page-load times down immediately.

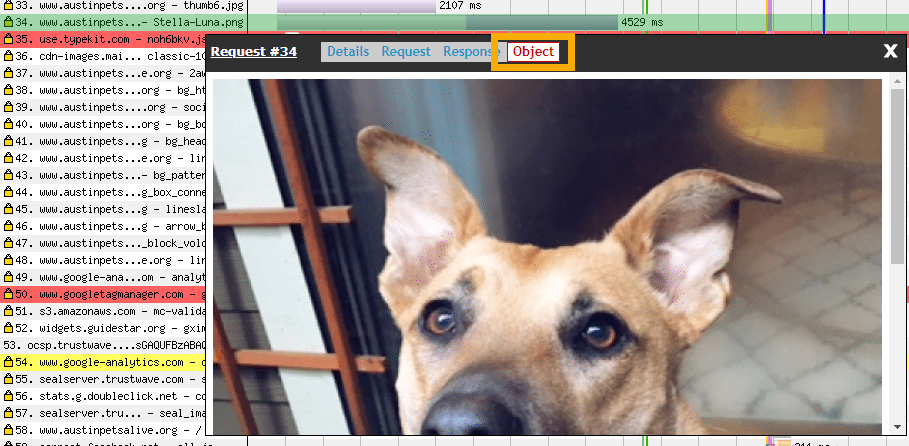
To help identify which image on the page the file is, click on the “Object” tab, and it will show you the actual image.
Total Image Weight
Even if you take the time to optimize individual images, there can still be an issue with the total image weight for a page due to the overall total images and graphics included on a page. This is a common issue plaguing ecommerce sites where long lists of products are listed on a single page, each with its own thumbnail image. To evaluate total image weight contributing to a page, run the URL test on WebPageTest.org, and then click on the “Content Breakdown” link in the main navigation.
I ran a test on the Amazon.com homepage, which is very image heavy, and discovered that nearly all individual image file sizes were pretty well optimized, but the combined compressed weight contributing to the page was more than 4MB! Ideally, total image weight for a page should be no larger than 250KB, with an overall page weight goal of 1MB. The images alone for this page are way beyond the ideal total weight for the page and are definitely dragging down the load time. At the time of this test, the page-load time was coming in at 8.29 seconds, which is very slow and absolutely has an effect on user click-through and abandonment.

Notice that the total number of images included on the page is 209, which is a pretty large number. This would be a great opportunity to test the effect of reducing the number of images on the page to observe how user metrics change. Sometimes, a bit higher page-load time is worth the trade-off based on usability; but that is rare, and testing would be needed to make the case for a revised layout that includes fewer images. In any case, using the previous data, you will get the insight you need to make the SEO case and gain traction with improvement initiatives.
Image File Format
The image file format is not typically an element that is evaluated by most SEOs when reviewing load time impact for a page, but it can be a source of substantial improvement if the majority of images are saved in the wrong file format. Most of the time, page-load time issues related to file format involve whether an image is saved as a PNG or JPG. I’ll save the details about vector graphics, image pixels, and image algorithms for another post, but the bottom line is that, when photographic images (images with many color tones, hues, or gradients) are saved as PNGs, the file sizes are ultimately much larger than if they were saved as JPGs.
One of the main reasons PNGs are frequently used for images on sites is because they support transparency and JPGs do not. This means that a PNG is much friendlier to designing a layout and allows more flexibility than a JPG typically does. However, PNG file sizes are usually not overly large for graphic images, such as logos, image spacers, or simple design elements.
Notice the difference in file size between an image from the NYTimes.com website as a PNG, which was slowing down page-load time by 2.8 seconds, and the same image as a JPG. The file size drops dramatically from 215.3KB to a tiny 23.1KB without compressing or otherwise adjusting the image file at all. The PNG version of the image was clearly chosen for layout reasons and transparency, but you can see how dramatic an effect a file format change can have on the page-load time, especially for sites where PNGs are used for the majority of images. Outside of layout considerations, a good rule of thumb to determine whether an image should be saved as a JPG or PNG is, if the image or graphic has a gradient, then it should be saved as a JPG. Otherwise, it can be saved as a PNG without any concerns for the effect of the file size on page-load time.

These three areas for image optimization should enable you to bring images for any type of site or template to within an acceptable range to minimize their effect on page-load times. It’s important to squeeze every last millisecond out of a page to be able to achieve Google’s golden threshold for page-load time. With these image optimizations and WebPageTest.org, you should be well on your way!
At Vizion Interactive, we have the expertise, experience, and enthusiasm to get results and keep clients happy! Learn more about how our SEO Audits, Local Listing Management, Website Redesign Consulting, and B2B digital marketing services can increase sales and boost your ROI. But don’t just take our word for it, check out what our clients have to say, along with our case studies.


