 Reading Time: 3 minutes
Many enterprises rely on Google Analytics to track customers wherever they are. The results allow businesses to optimize their websites and pages, pinpoint opportunities for improvement, and understand where their channels are the most successful. This is an easy way to attribute conversions and online transactions to a specific source or medium, whether it’s an ad campaign, organic search, or any other entry point that led to a consumer’s purchasing decision.
Getting started and sorting through the vast amounts of information Google Analytics uncovers, though, can be difficult. Here are three easy-to-use features that will give you everything you need to track the effectiveness of your digital efforts without suffering from data overload.
Channel Reports
Analysts rely on Channel Reports to determine the effectiveness of referrals, search engine ranks, and ads based on the medium or channels that brought them to the site. Default channels include Direct, Referring Site, Organic Search, Paid Search, Social and Email. Diving into specific channel segments allows you to assess important metrics such how long it takes a user to go from landing on a page to making a purchase, but specifically from that channel’s referrals. Understanding this information can help a business streamline the research process and as well as understanding how users of different channel origination behave on the site.
Google Analytics’ Multi-channel Funnels report gathers information unveiling where the traffic to your website is coming from with a consideration on what channels may have been original referrers that resulted a user entering the site again through a different channel before becoming a converter.
This is useful for businesses because the Channel Reports track through all site touch points a user went through, not simply the last link they clicked through before landing on your page. It also documents the total value of sales and conversations associated with each channel, so you can see if one method is more effective than another.
Goal URLs
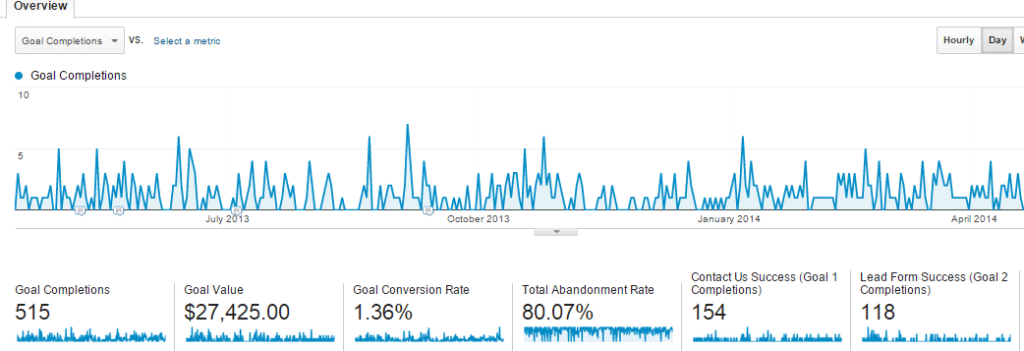
Creating Goal URLs is a way companies can evaluate user behavior when viewing a specific conversion goal associated with your website – for example, lead submissions and transactions. Users can create their own or use Google’s templates to set standard, actionable business goals. For example, these can include parameters related to revenue, client acquisition, and engagement. This is an excellent way to see how site users are reaching your site objectives.
Advanced Segments
Pinpoint how different types of traffic flow through your site with Advanced Segments. For example, you can set geo-specific parameters to see where users from a certain city or state are coming from and how they behave. Website owners can set up these segments to view Google Analytic reports for users who meet certain standards; create custom segments according to demographics, means of access (i.e. mobile devices), where users go on a page, when they first visited, and where from; track behavior based on restrictions like age and gender; and share results with whoever would like to view the information. This information can easily be accessed and manipulated within Google Analytics’ dropdown menu, and it is an incredibly thorough way to see how’s, and why’s of who is accessing a specific site.
Get Started!
Google has many helpful resources and information on the full gamut of features its Analytics program has to offer. While the system is immersive and highly customizable, these are some of the most universally valuable features it has to offer. Use these resources to more fully understand where and why your site is effective, as well as what areas may need a thoughtful revision.


